Tutorial 1 covers in detail steps that are glossed over in this tutorial. Tutorial 3 covers creation of the target layout.
Looking at available sample layouts there are 2 that offer replication - 2S4T and 4S2T:

2S4T: Entire plate coated with the same target, samples in duplicate. Note that sample replicates are in the same row. (see tutorial 2 )
4S2T: Each sample tested in duplicate on 2 targets. Note that target replicates are in the same column.
Following tutorial 1 I will rearray the 10 plates of PS-6 into a new plate set applying the 4S2T sample layout. Ten 96 well plates in quadruplicate will requires ten 384 well plates, one 96 well plate in all 4 quadrants of a 384 well plate:
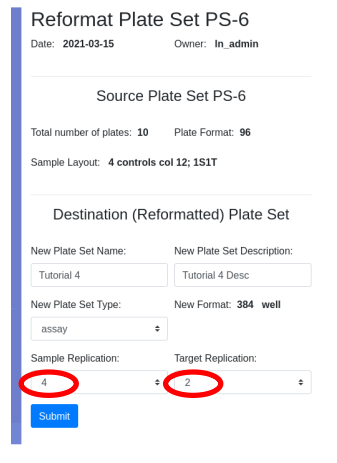
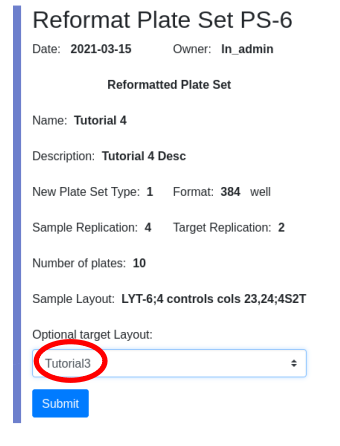
I will use the target layout created in tutorial 3 as the target layout, providing me with duplicate assay results for each sample.
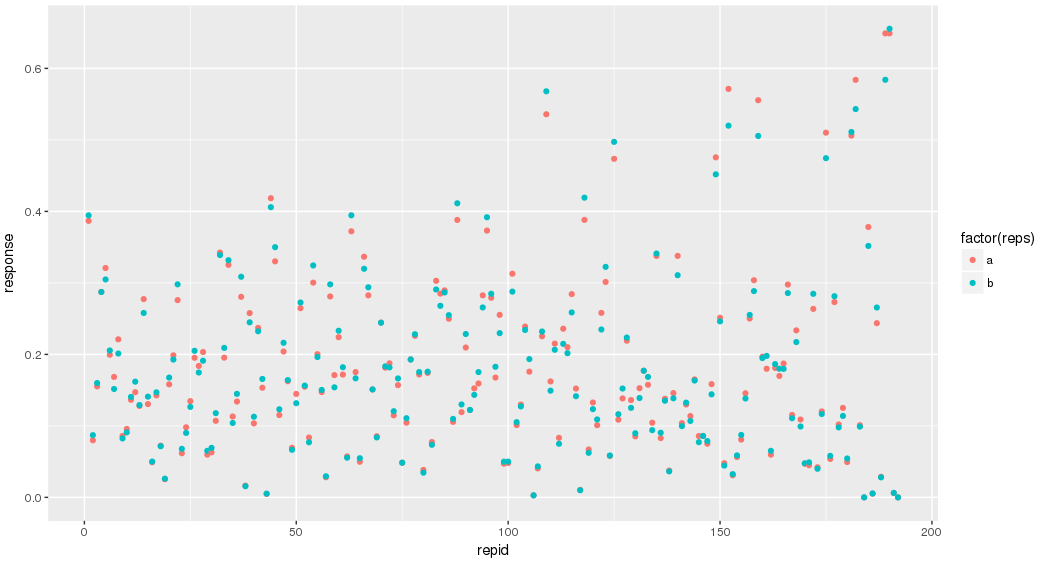
Use the data file plates384x10_4S2T.txt which contains demonstration data for ten 384 well plates. The data has been generated such that replicates are one above the other in the same column and are +/-10% of each other. In the graph below replicates for one plate are color coded and appear at the same X value:
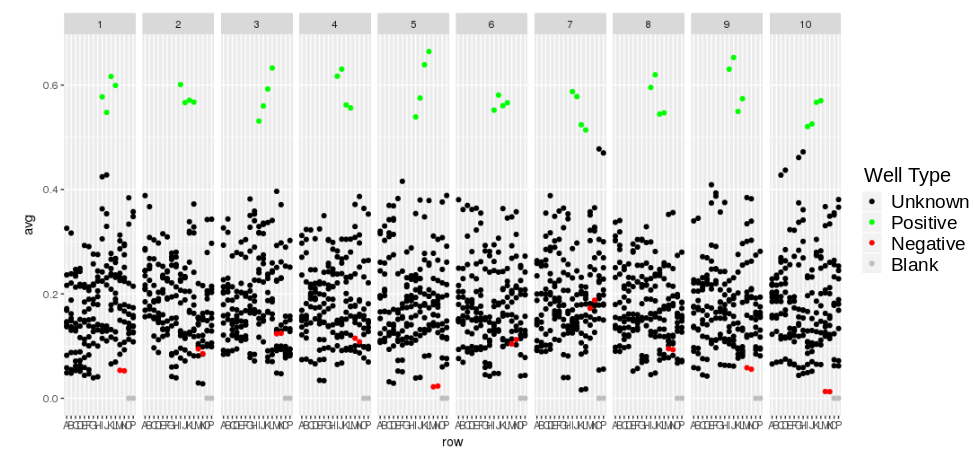
Looking at the response trellised by plate and colored by sample type:
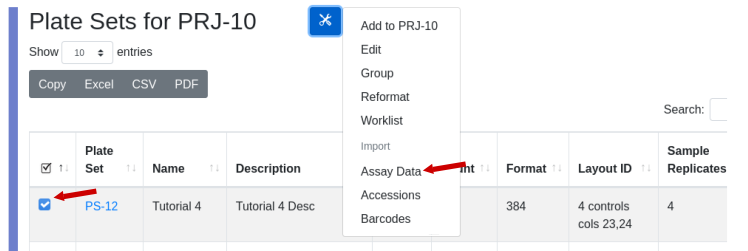
Associate the data with the plate set. Note that plate set, hit list, and assay run ids may differ from what is shown if you worked through all the tutorials:
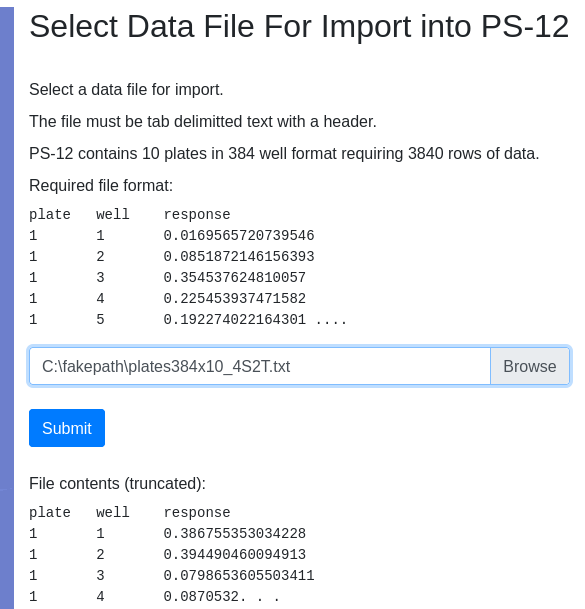
Select the file you downloaded:
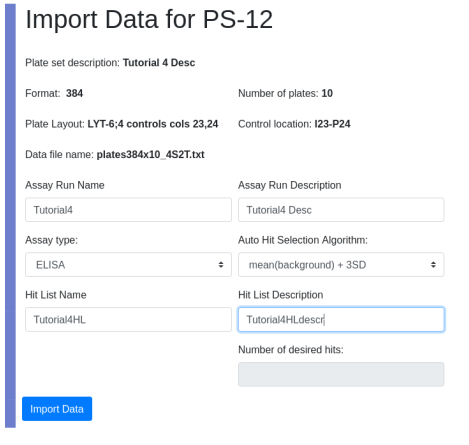
Provide requested information and import data:
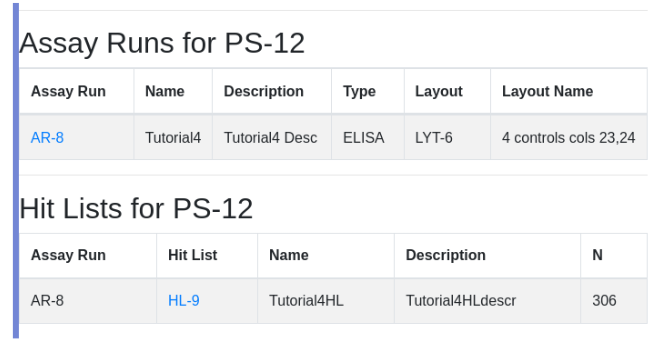
View the assay run and hit list under PS-12
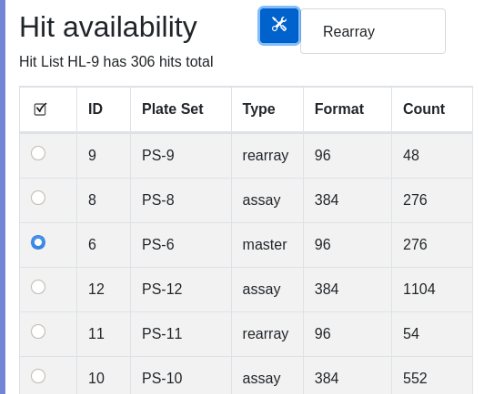
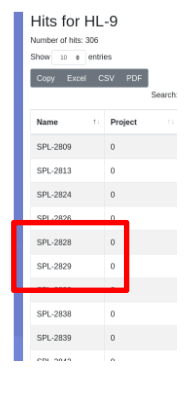
Navigate into HL-9 and view hit availability. Note that the hit list has 306 hits. PS-6 is the master plate that provides the hits. The discrepancy is discussed below.
Responses are plotted in decreasing order with controls color coded. Not that if you select normalized response with a hit threshold set to mean(background)+/-3SD, 306 hits will be identified. The hit list could have been created here, but was already auto-generated on import.
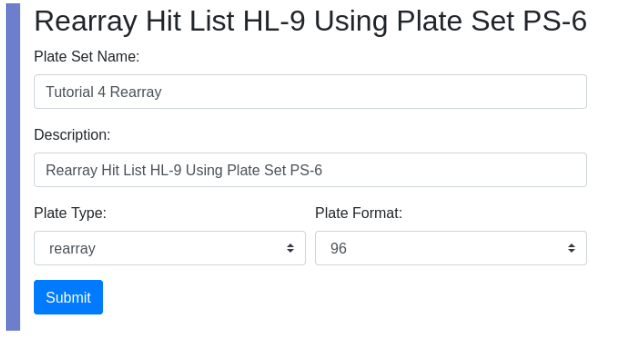
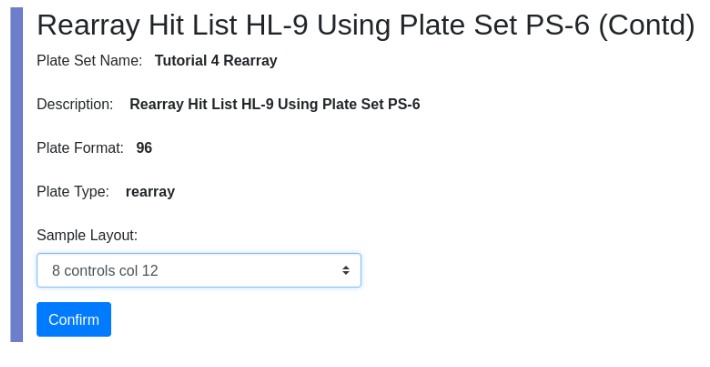
View the new plateset PS-13. Note the associated worklist because this plate set was created by a rearray action.
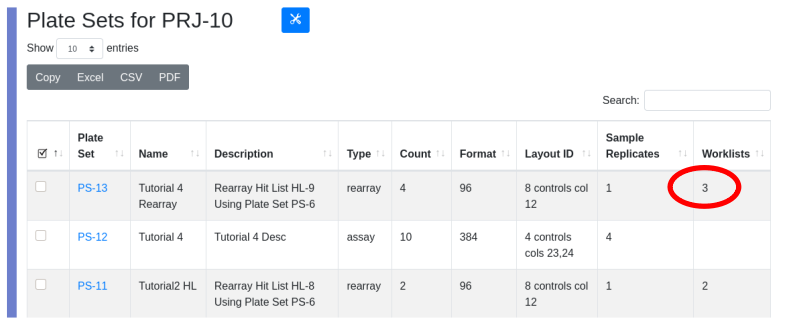
Note that the hit list contains 306 hits but the parental plate set PS-6 only contains 276 of the samples designated as clones. Seven of our samples have scored as hits on both target 1 and 2. This can be seen in the exported worklist below. For example sample SPL-2829 scored on both targets, but will be rearrayed only once. To characterize which samples score on which target, you must export the results and analyze outside LIMS*Nucleus.
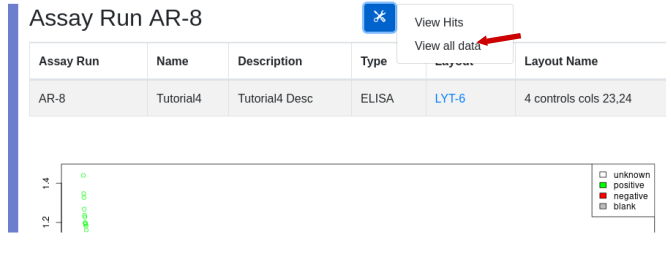
Processed data can be exported for further analysis. While viewing an assay run, use the ‘View all data’ to generate a table that can be exported to Excel:
Results are exported into whatever application you have associated with .csv files:

Note that due to the use of defined targets, the target annotation appears in the worksheet. For targets both the name and accession are available. Sample accessions were not imported and so don’t appear. Compare to an analysis where the default target annotation is used, such as PRJ-1, AR-1. The generic target label “Target1” is used, without any associated accession:
