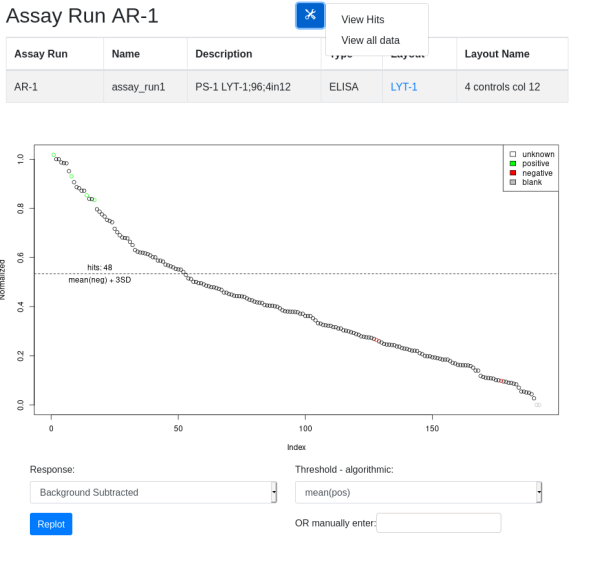
In the plot view you are given the option to replot data using different normalizations and thresholds. In any view hits are calculated based on the selected parameters. These hits can be viewed by selecting the tool icon ‘View Hits’ option. In the hits view a hit list can be registered. The ‘View All Data’ option provides a table of all the underlying annotated data for export. External software can then be used to analyze the data and generate hit lists:
