My previous post got me wondering about the relative number of Democratic and Republican votes in the top counties:
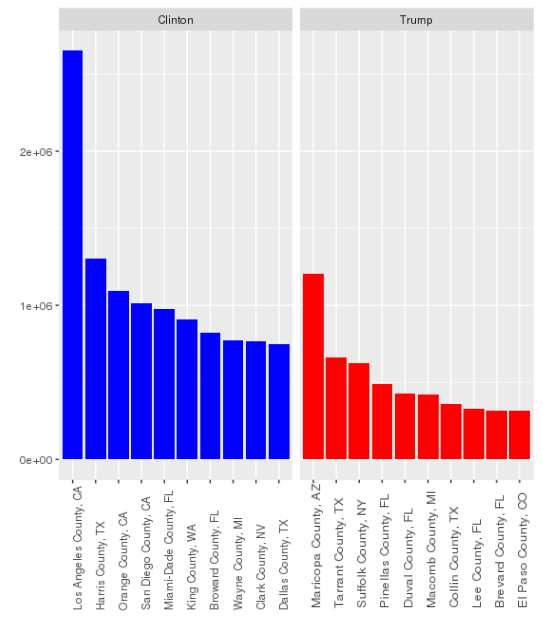
California, Texas, Florida stand out, with LA alone accounting for ~3% of Clinton’s vote. It would be interesting to know how many of those votes were illegal aliens, given that Obama was encouraging illegals to vote. How is requiring proof of citizenship to vote bad for us as a country? I would go further and require not only proof of citizenship, but also proof of high school graduation or the equivalent. Furthermore, lets put an age cap of 75 years on voting. After 75 years you have had 57 years to influence the political direction of our country. Time to step aside and make room for the next generation. Voting is about the future, and at 75 you don’t have much future left. Furthermore cognitive decline may be having an adverse negative effect on decision making. This will also minimize the impact of voting scams that target the elderly.
1 | ##source: https://raw.githubusercontent.com/tonmcg/US_County_Level_Election_Results_08-16/9db796f730956d0a506d51fa653f583a6eef70a3/2016_US_County_Level_Presidential_Results.csv |
Note that I could not figure out how to apply separate x axis labels across facets and had to resort to cut and paste.